South
Tasmania

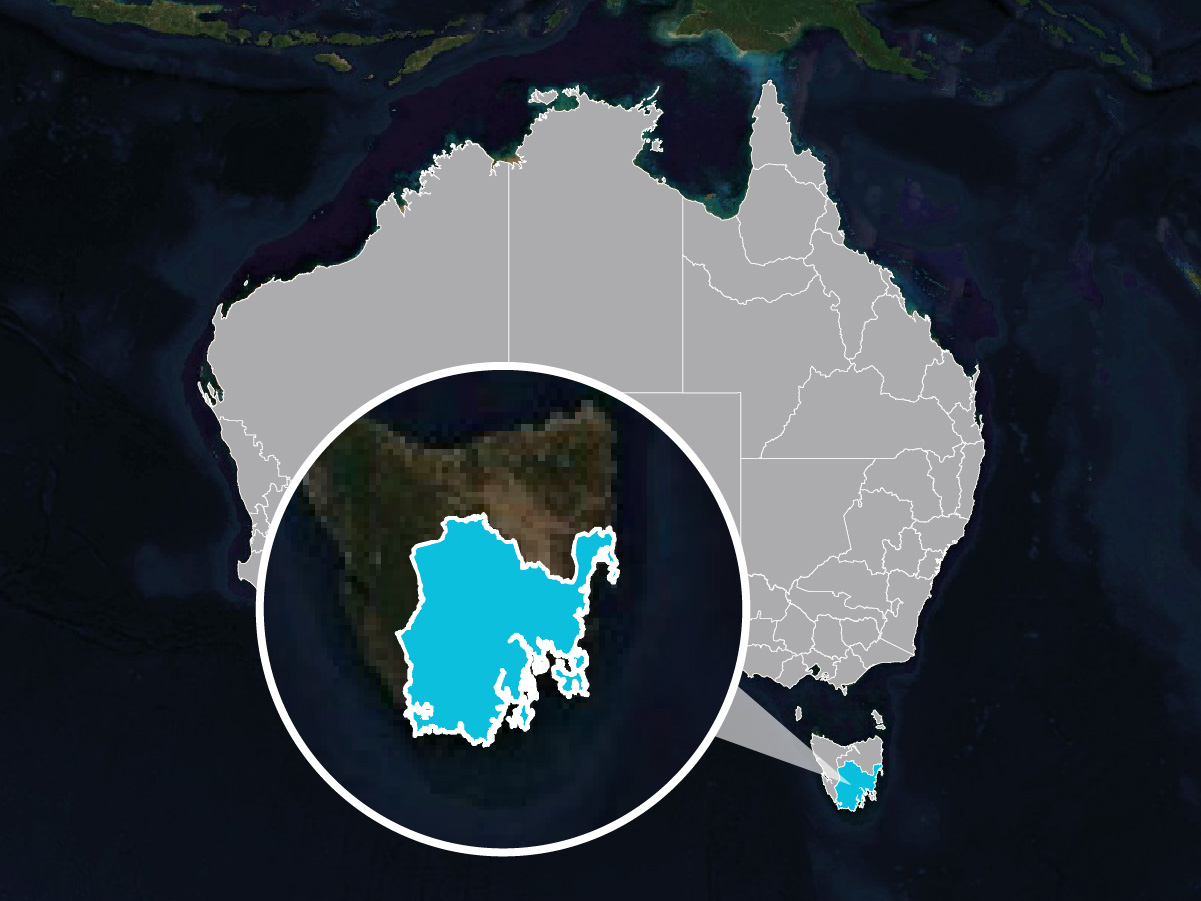
| Location: | Southern Tasmania |
| Traditional Owners: | Palawa / Pakana (Tasmania) and local groups of the Muwinina, Melukerdee, Lyluequonny, Nuenonne, and Mumirimina peoples |
| Regional body: | NRM South |
| Area: | 25,000 (km2) |
| Catchments: | Derwent River, Gordon River, Huon River, Jordan River, Coal River, Prosser River and Aspley River. 17 sub-catchments. |
| Population centres: | Hobart, New Norfolk, Huonville, Sorell, Triabunna, Swansea, Bothwell. |
| Local government areas: | Hobart, Glenorchy, Brighton, Clarence, Kingborough, Huion Valley, Derwent Valley, Central Highlands (TAS), Southern Midlands, Glamorgan-Spring Bay, Sorell and Tasman |
| Domaint land uses: | Conservation (62%), Forestry (14%), Grazing (15%) |
The Southern Tasmania Natural Capital Region covers south eastern Tasmania, centred around Hobart including the Derwent River, Huon River, the central highlands and lakes region, the southern midlands agricultural region, Bruny Island, the Tasman Peninsula and eastern catchments to Bicheno. The region includes large areas of World Heritage Wilderness Area including the Southwest National Park to Bathurst Harbour in the south west, the Franklin—Gordon Dams region, Mt Field National Park, Freycinet National park and the central highlands. The region stretches 200km north to south and 200km east to west.
Dissolved inorganic nitrogen generated
tonnes per year
Fine sediment generated
kilotonnes per year
Woody vegetation cover
square kilometres
Riparian and wetland woody vegetation cover
square kilometres
Explore the current condition in the interactive condition report below – Click on a sub-catchment to view a report on the natural capital measures for that sub-catchment in the ‘report’ tab.
Choose the natural capital measures that are important to you – Select the ‘hotspot’ tab and check the indicators that are important to you. Then view measures that are aggregated and range standardised from the highest to the lowest value across the sub-catchments (red for worst and blue for best). By simultaneously considering multiple natural capital measures you can instantly see where the greatest opportunities for natural capital improvement are.
One of the most common uses of Natural Capital Region is to prioritise what to do and where to do it and to forecast the future natural capital condition under alternative nature repair investment programs.
The rapid scenario creation and running allows for the development of co-operative investment strategies that include the priorities of multiple partners (e.g. NRM organisations, federal government, state government and local government).
To facilitate this rapid scenario generation, Natural Capital Region includes region-specific libraries of tens of possible on-ground actions. Each action includes their effectiveness for improving natural capital outcomes, the cost per hectare of the action and the likelihood of adoption of each action.
To demonstrate, a simple investment scenario is embedded below.
| Budget: | $20,000,000 |
| Area: | All sub-catchments |
| Positive Actions: | Terrestrial and riparian revegetation nature repair and conservation actions (protecting remnant vegetation and native revegetation replanting) |
| Negative Actions: | Do not consider the implications of negative actions (eg. excluding impacts of ongoing clearing or urban expansion) |
| Maximum area per sub-catchment: | Set the maximum area for each action per sub-catchment as 10% of the available area for that action (spread the investment across several actions) |
| Adoption likelihood: | Use likely landholder adoption rates (includes total proportion of landholders and time to achieve adoption) |
| Priorities: | Prioritise based on water quality and biodiversity outcomes and actions that include high First Nations engagement |
Explore the scenario results spatially – Click sub-catchments on the map to see the cost breakdown over time and by sub-catchment.
Explore the marginal cost abatement – This shows where the rate of improvement vs cost starts to flatten off. Hover over the chart to see a breakdown of each suggested action by sub-catchment with the associated co-benefits of the action quantified.
Natural Capital Region forecasts a potential future state by considering alternative on-ground actions. A critical step in this process is compiling the data to establish the baseline condition for the region.
Metadata for the indicators (and groupings used in Action set up) included in the South (Tasmania) instance of Natural Capital Region have been thoroughly documented.
Access to Natural Capital Suite is currently curated.
Contact us to gain access.
Subscribe to our mailing list for all the latest news and developments about Natural Capital Suite.

Truii acknowledges the Traditional Owners of Country throughout Australia. We pay our respects to Elders past, present and emerging.


